A lot has changed over the years. Businesses have changed their way of preparing actionable insights and mapping the changes.
Data in the raw form is the last thing you would want to check your business’s progress. Data can be represented in two forms; spreadsheets and data charts. While spreadsheets can be used to sort the data efficiently, the data charts are more intriguing.
Data charts in the form of bar charts, line graphs, and other forms can be more valuable and understandable for the customers.
Hence, the data visualization tools are among the most popular tools for small to large businesses in .
Contents
What Is Data Visualization?
Data Visualization is the visual representation of data in the form of bar graphs, line, and curves, maps which helps and analyze data into much simple form. With the help of data visualization tools, you can create and represent any data in the form of bars and graphs.
Data visualization tools are used by various data scientists and marketers to sort and create complex data into a simple bar graph, curves, and actionable maps.
Now, there are a number of data visualization tools that you can use to create data for your business. We have shared a list of best Data Visualization software based on various features including ease of use, Drag and Drop editor, Integration capabilities, and pricing.
These tools provide various interfaces, database connections combined with Machine Learning and AI.
Best Data Visualization Tools To Try Out
1. Tableau
Tableau is a robust data visualization software that helps in the visualization of data in the form of actionable forms. It is used by the majority of data scientists and statisticians to get clear data analysis.
Tableau is a top-notch software with high-security databases and handles security issues when they arise or found by the users. The data is first created, sorted, and cleaned to convert it finally into data.
Tableau is an amazing option for corporate companies who want to view data without setting it up manually. Moreover, Tableau for desktop is fairly easy to use and offers an interactive dashboard to provide actionable maps.
Pros:
- Easy To Use
- 14-Day Free Trial
- Integrates Seamlessly with 250 applications.
- Offers various versions such as Tableau Server, and cloud.
- It also offers Java Script extensions and APIs.
Cons:
- No automatic refreshing for reports
- Inflexible pricing plans
Pricing: $70/user/month
2. Looker
Looker is an amazing business intelligence and data visualization software that helps explore and analyze data with ease. These data can be used in the form of diagrams and actionable plans.
Based on these data, users can make decisions and represent data in the form of visual diagrams. Moreover, the real-time dashboard lets people track and create data in the form of visuals and make instant decisions.
Furthermore, the users can use APIs to create and integrate with the workflow. Looker helps combine the charts and create subtotal of tables. Looker also connects with SQL databases and other dialects to connect with multiple databases.
Pros:
- Organize huge sets of data together.
- Easy To Use
- Data Charts can be shared with anyone in any format.
- 24/ Customer support
Cons:
- Limited Integration options
- Some visualization features missing
Pricing: Available on Quote
3. Power BI
Power BI is yet another powerful and free data visualization software. It is powered by Microsoft and is widely used in converting the data into dashboards and reports.
With a SaaS-powered dashboard and powerful solutions, the PowerBI platform gives real-time analysis of the data. Power BI has a wonderful self-analyzing tool that aggregates the data into actionable form and creates it into shareable form.
Pros:
- Data Sources are Cloud-based and On-Premise.
- Built-in AI capabilities and excel integration.
- Integrates with various Microsoft Tools
- Power also gives multiple connectors and devices.
Cons:
- Complicated learning curve.
- Bulk Data is usually difficult to manage here.
Pricing: It offers two pricing plans. The first plan is completely free with storage of up to 1 GB. The other plan is also called PowerBI that costs $9.99/user/month with 10 GB storage.
4. Qlik Sense
Qlik is an end-to-end data visualization tool used by data scientists, data analysts, and marketers for converting information into data.
This tool uses features such as a data analytics engine, sophisticated Artificial Intelligence system, and scalable multi-cloud architecture to use and deploy the combination of SaaS, On-Premise, and cloud solutions.
Pros:
- Drag and Drop Interface for creating the data analytics.
- It uses features like Qlik Sense AI and ML to load and visualize data.
- Data can be integrated from various sources and deployed into a single application.
- Free 30-day trial
Cons:
- Steep learning curve
Pricing: Qlik Sense for Business costs $30/user/month and Qlik Sense Enterprise SaaS plan costs $70/user/month.
5. Zoho Analytics
Zoho is an amazing Data visualization software that takes up the raw data to create actionable reports ad dashboards. With tools like Zoho, you can create data visualization diagrams using drag-and-drop features.
The best part about Zoho is that it has AI-based that creates data in the form of reports by answering few questions.
Pros:
- Easily embeddable links to share on social media.
- It extracts the data from various multiple sources to gather it in an actionable form.
- Stellar Customer Support
- Collaborate Securely with the Team
Cons:
- Filters can be made more simple.
- UI should be improved.
Pricing: Zoho gives a 15-day trial with various features. The pricing range from $25/month to $495/month.
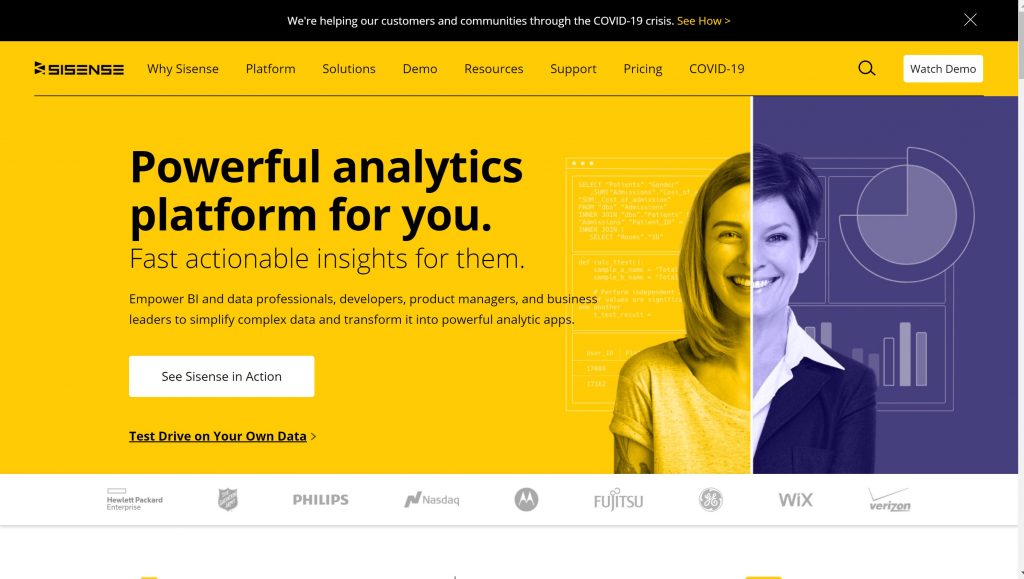
6. Sisense
Sisense is a handy data visualization software for beginners. It creates intuitive dashboards and reports along with uncovering the underlying trends in the industry. This lets users make data-driven business decisions.
Sisense makes use of multiple sources to simplify the complex data and segregate them in the form of bars and reports.
Pros:
- Easy To Use Platform which groups complicated data in a single dashboard.
- Export Data to CSV, PDF, and Excel format.
- Cloud-based Platform
- Offers Integration with Different data sources
Cons:
- Only Limited Visualizations
- No feature to support time format in data.
Pricing: Sisense pricing is available on demand. Depending on your needs, Sisense quotes the pricing.
7. Chart.js
Chart.js is a versatile data visualization tool with various capabilities. It is considered an amazing choice for developers and designers. This comes as free because an open community of data scientists has developed it.
However, the tool is best suited for the small scale companies with less requirement of data visualization and analysis.
Pros:
- It comes with 8 different data charts including the polar bar and radar pie.
- Easy To Use Dashboard
- Data charts are customizable and come in different colors
- Offers scale granularity for redraw.
Cons:
- It is slow and takes time to form data as compared to others.
Pricing: Completely Free To Use
8. Leaflet
Leaflet is a top-notch and open source data visualization platform for small businesses. It is majorly available on mobile and desktop. Moreover, the data can be created and executed using the APIs.
Moreover, the users can zoom a specific area by using the double-click. It is best for organizations that create big data mapping solutions.
Pros:
- It lets you add heatmaps, masks, and markers.
- Supports Firefox, Chrome, and Opera.
- Drag marker to a specific location using drag and drop.
- Helpful community support
Cons:
- Slow in processing
- The platform might show an error during coding.
Pricing: An open-source data platform and completely free to use.
9. Google Charts
Google Charts is a powerful and intuitive data visualization tool that is free to use and comes with various features. Google Charts has a wide range of templates for creating charts and bars.
Google Charts is a user-friendly and open-source tool that gives users control over the charts. Users can create anything from simple charts to complex hierarchical trees.
Pros:
- Seamless Integration with Google Products.
- Mobile App for Android and iOS.
- Extracts data from multiple sources including SQL, CSV, and spreadsheets.
- Extensive gallery of charts and templates
Cons:
- Not for professional data scientists
- You might face difficulties in personalization.
Pricing: Completely Free To Use
10. FusionCharts
Fusioncharts is an amazing software for creating charts and bars from the raw data. It is a JavaScript library that can be used for creating data visualization charts. The library offers over 2000 maps and 100+ charts.
It is mostly suitable for large businesses with the need for building dashboards.
Pros:
- It offers an extensive library along with clickable data forms and numerous color schemes.
- It supports various browsers including IE, Chrome, Firefox.
- FusionCharts offers large customization options for creating dashboards.
- Integrates seamlessly with JavaScript and other programming languages.
Cons:
- Customization options can be improved.
- Prices are slightly high.
Pricing: The basic plan of FusionCharts starts with $497/user/year and ranges to $2,499/user/year. It also offers a free trial before the subscription.
11. Adaptive Insights
Adaptive Insights is a top-notch data visualization platform that gives direction to your business by giving complete information in the form of data charts.
It is used by various data scientists for representing the sales, trends, and changes by visualization and storytelling. Adaptive Insights has various tools to model, plan, and forecast, and make better decisions.
Pros:
- Intuitive Dashboard to create reports effortlessly.
- You can even plan a budget for the project.
- Adaptive insights can be connected to data sources such as CRM and ERP.
- Easy Collaboration with the people.
Cons:
- Reporting Functionality needs improvement.
- The tool is a bit slow in creating data.
Cost: Pricing is available on quote. It works on a subscription-based model. You can choose two plans; Adaptive Insights Professional and Adaptive Insights Enterprise.
12. Domo
Domo is a cloud-based business intelligence platform that gives amazing visualization and critical insights into your data. Domo shows data in the form of graphs and pie charts with the ease of creating data maps.
The visualization of data can be represented on any device. Moreover, the customization can be done on texts, images, and colors. This tools is on-cloud and gives a real-time analysis of the data.
Pros:
- Offers Integration with various software.
- Reports can be shared with anyone on the cloud.
- Users can set customized alerts.
- Domo also offers robust dashboard personalization.
Cons:
- Complex dashboard and time consuming for the newbies.
- It lacks NLP and ML components.
Pricing: Domo offers a free version along with two paid plans. The pricing starts from $83/user/month.
Wrapping Up
Now, you must be well aware of the list of Best Data Visualization software and tools that you must try. Considering the above features and pricing, it would be easier to find out the best visualization software for your needs.
Take a free trial or get the demo and try your hands on any of the above data visualization tools. For the newbies, the best options are Chart.js, FusionCharts, GoogleCharts and Leaflet.
If you need more features, you can consider other tools as well. Hope this article has given you an idea about the best Data visualization tools.
Do let us know in the comments if you have more products to recommend.
Also Read:
- 10 Popular Open Source Intelligence Tools for Penetration Testing
- 10 Best Data Modeling Tools To Manage Complex Designs
- 10 Best Big Data Analytics Tools & Software

